Chemometric Investigation of Polarization Curves: Initial Attempts - ppt video online download
By A Mystery Man Writer
Outline Polarization Curves Data Methods Results Future Work Definition and Terms Motivation for Chemometric Approach Differences from Spectroscopic Data Data Methods Results Future Work Acknowledgements
Chemometric Investigation of Polarization Curves: Initial Attempts
Christopher A. Marks. Center for Electrochemical Science and Engineering. University of Virginia. Charlottesville, VA – USA.
Definition and Terms. Motivation for Chemometric Approach. Differences from Spectroscopic Data. Data. Methods. Results. Future Work. Acknowledgements.
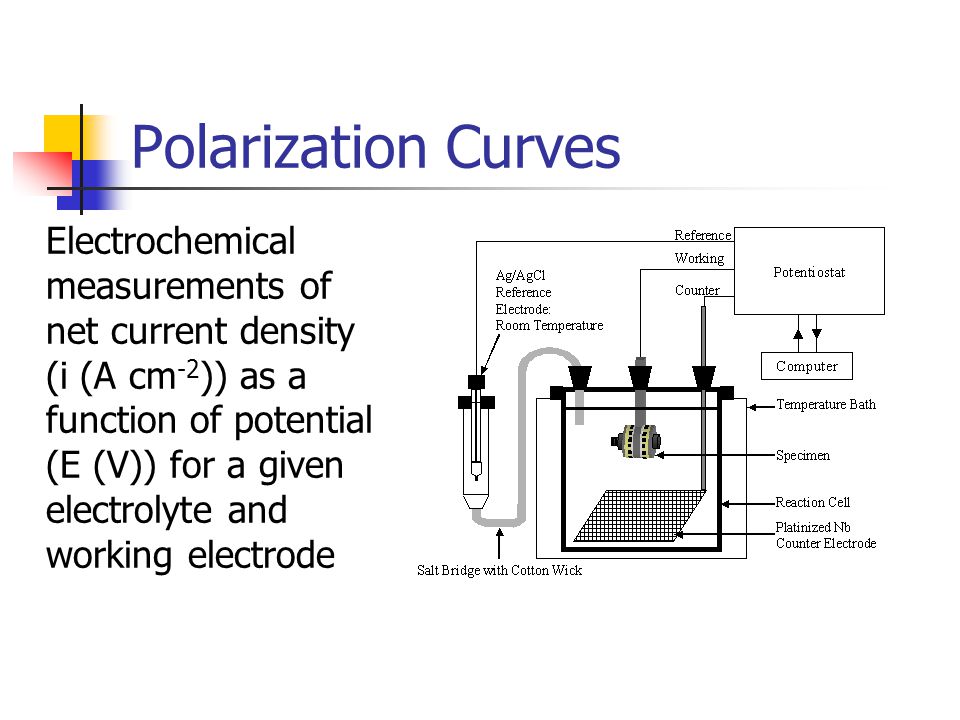
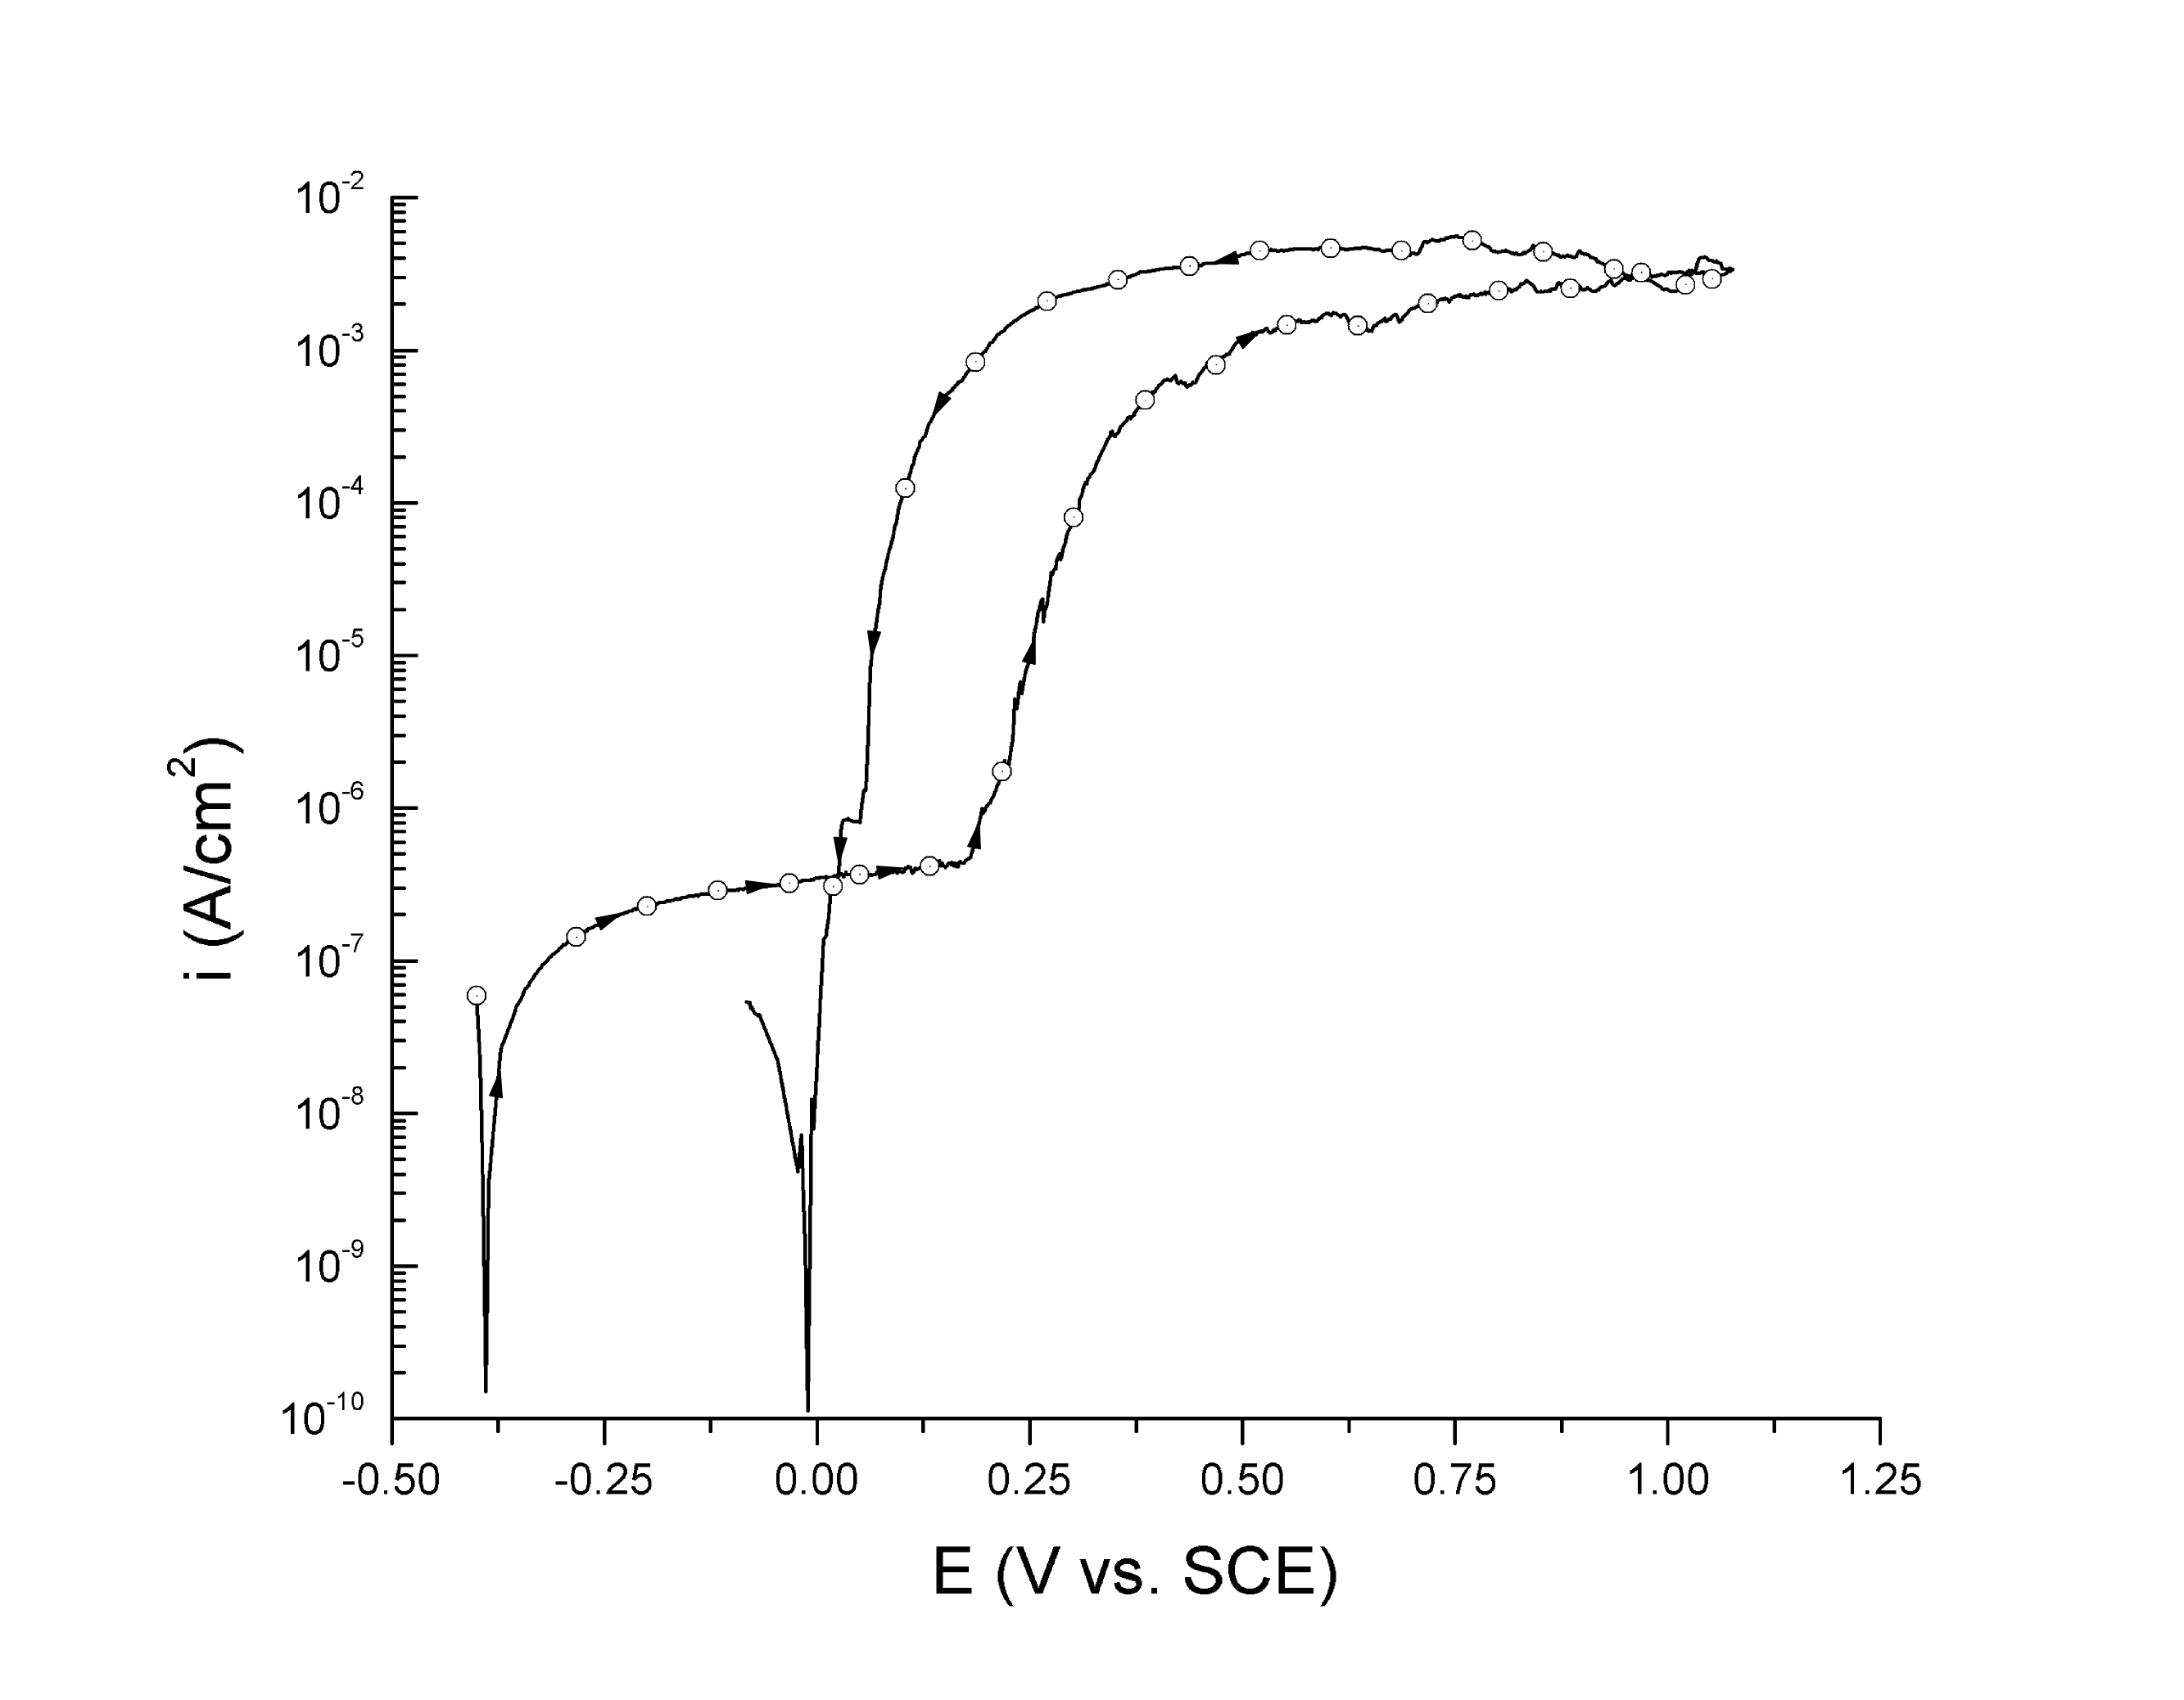
Electrochemical measurements of net current density (i (A cm-2)) as a function of potential (E (V)) for a given electrolyte and working electrode. E versus some reference electrode. Importance of net current. i and log(|i|)
E versus some reference electrode. i and log(|i|) Exchange current density can change. Diffusion limited current density changes as a function of [O2], pH and stirring, etc.
Exchange current density can be a function of electrolyte. Alloys are more complicated than a pure metal, non-stoichiometric dissolution. Passivity is more complex than indicated.
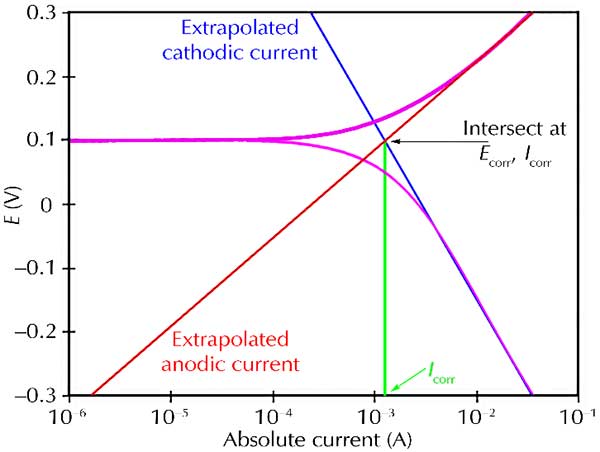
inet = ianodic + icathodic. M Mn+ + ne- 2H20 O2 + 4H+ + 4e- O2 + 4H+ + 4e- 2H2O. Only a small fraction of what is of interest can be measured experimentally. Net curve is offset slightly for clarity. E versus some reference electrode. Importance of net current. Define Eoc, Ep, and ipass.
Resolve net current data into components which are simple functions of pH, [Cl-], [O2], [Mn+], etc. so that the important parameters, Eoc, Ep, and ipass, can be optimized or interpolated. Compare to anova, etc. of values picked from curves.
Non-constant domain (non-random missing data) Variable uncertainty in i, depends on i, not E. How to calculate 2 Discuss how uncertainty in i is a function of i,
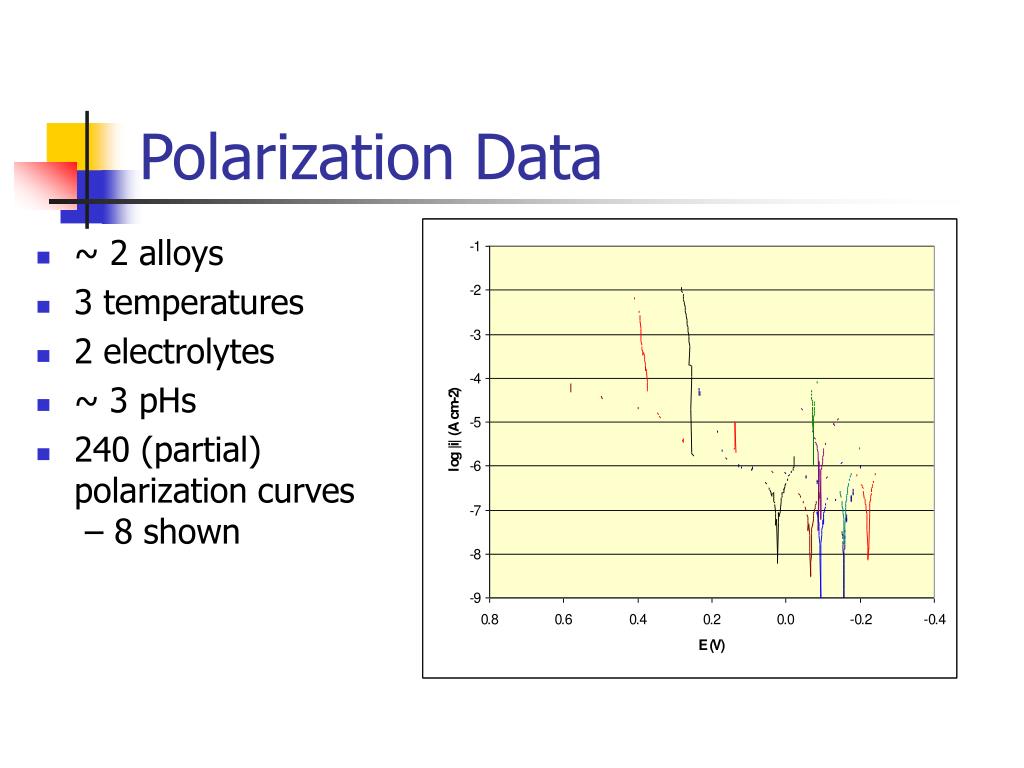
240 (partial) polarization curves – 8 shown.
No mean-centering or scaling. Missing values replaced by estimates (Xestij=tipj) Iteratively re-weighted least squares. Estimate loadings (p=(t’t)-1t’X) Calculate variable weights (v) based on p (vi = # obs / (a priori uncertainty for pi)2. Estimate scores (t=Xdiag(v)p’(pdiag(v)p’)-1) Go to 1, until convergence. Orthogonalize p with respect to the previous P.
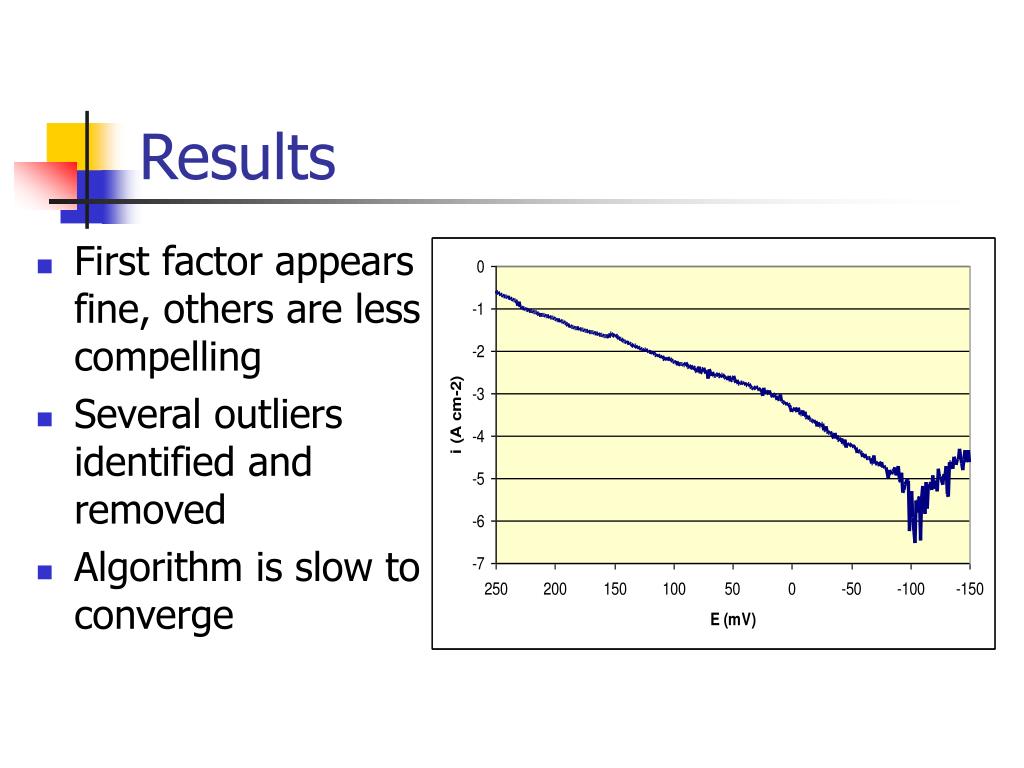
Several outliers identified and removed. Algorithm is slow to converge. First factor.
Results 6 component residuals are bothersome, not making progress but still large residuals
Verify target function and weighting. Non-orthogonal P. Simulated data. Smaller/simpler data sets. Non-negative T (P ) and/or Rotations. PLS and other techniques. Time series. EIS, 3-way Spatial electrode arrays.
B.A. Kehler, G.O. Ilevbare, J.R. Scully, Comparison of the Crevice Corrosion Resistance of Alloys 625 and 22, CORROSION/2000, paper no. 182, NACE, B.A. Kehler, Crevice Corrosion Electrochemistry of Alloys 625 And C22, University of Virginia, Charlottesville, January, John Scully, Rob Kelly, et al. – CESE. Jack McArdle – UVa Psychology. WSC1 presenters and participants.

PPT - Chemometric Investigation of Polarization Curves: Initial Attempts PowerPoint Presentation - ID:3079600
Potentiodynamic Scan/Cyclic Polarization Gamry Instruments
PPT - Chemometric Investigation of Polarization Curves: Initial Attempts PowerPoint Presentation - ID:3079600
Miquel Perello Nieto
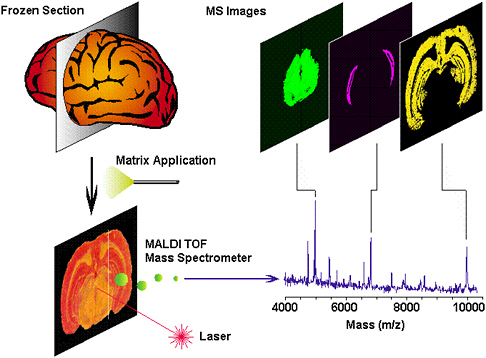
3 Imaging Techniques: State of the Art and Future Potential, Visualizing Chemistry: The Progress and Promise of Advanced Chemical Imaging

On the importance of time-resolved electrochemical evaluation in corrosion inhibitor-screening studies

The Weak Theory Of Advertising

3 Imaging Techniques: State of the Art and Future Potential, Visualizing Chemistry: The Progress and Promise of Advanced Chemical Imaging
PPT - Chemometric Investigation of Polarization Curves: Initial Attempts PowerPoint Presentation - ID:3079600
- How to plot polarization curves – About Corrosion
- Polarization curves: (a) the polarization curve as current density, (b)

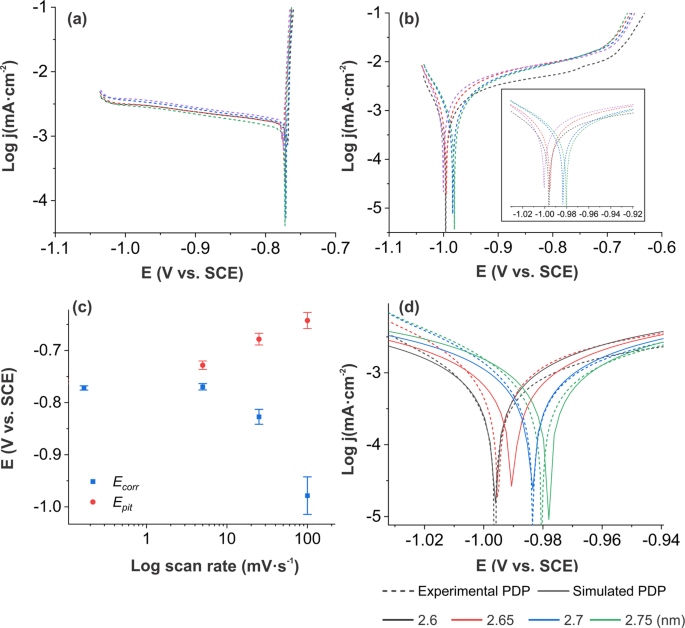
- Potentiodynamic polarization curves of AA7075 at high scan rates interpreted using the high field model
- Polarization Curve, scatter chart made by Peidano46

- Kinetics of anodic dissolution of Zr in acidic fluoride media - IIT Madras